Pattern · seen in 1 breakdown across 1 company
Dead Man's Switch
Detect failure by watching the system's steady 'I am alive' heartbeat, and raising the alert when that heartbeat stops - because a system that has died silently cannot report anything.
The mechanism
At its core: a healthy system sends a steady heartbeat, and an outside observer just counts it. When the beats stop, that silence is the alert - which catches the failures a system can never report itself, because it has already died or been cut off.
A crashed system can't send an error - but a dead man's switch hears the heartbeat go silent and raises the alert anyway.
Definition
A dead man's switch spots failure by watching for a signal to stop, not for an error to appear. A healthy system sends a steady heartbeat - a regular message, a timestamp it keeps refreshing, a probe that keeps passing - and an outside observer just counts them. When the heartbeat stops, the observer raises the alert. The silence itself is the signal.
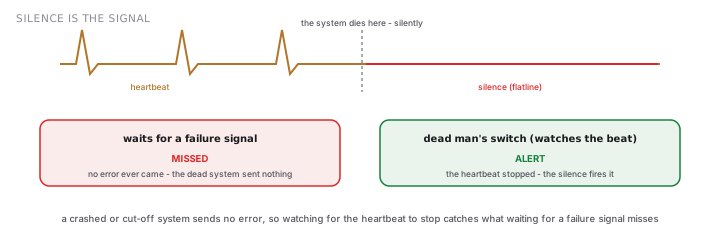
A monitor is itself a system that can fail, which leads to a problem with no end. If a monitoring service watches your app, what watches the monitoring service? Adding another monitor on top just moves the question up a level, forever - and the one at the very top can still die quietly. A dead man's switch escapes this by flipping the question. Instead of asking 'did something break?', which needs a working detector to answer, it asks 'is the system still saying it is alive?', which needs nothing more than the ability to count messages.
The final observer is kept as dumb as possible - a simple alert that fires on a low message rate, a scheduled job checking a file's timestamp, a load balancer expecting a certain reply. And it has to live in a different failure domain from the system it watches; a watcher that shares infrastructure with what it monitors gives no protection, because the same failure takes them both. The whole pattern rests on the observer surviving when everything else has died.
The same idea shows up well outside software. In each case, something has to keep actively proving it is okay, and the moment it stops, that is the warning:
- a device that reboots itself if its software stops checking in
- a train that brakes on its own if the driver stops pressing a pedal
- a machine that runs only while two operators each hold a button down
- a medical alert that calls for help if someone misses their daily check-in
When it applies
Tradeoffs
The same move, 1 ways
Every row is a production system that bet on this pattern — the note says how, in that system's own terms.
Problems this pattern answers
The walls where its breakdowns live — each opens the cross-company comparison.